• AI글쓰기 2.1 업데이트
  • AI글쓰기 2.1 업데이트
  • AI글쓰기 2.1 업데이트
  • AI글쓰기 2.1 업데이트
  • 통합검색(206)
  • 리포트(196)
  • 논문(5)
  • 시험자료(4)
  • 방송통신대(1)
판매자 표지는 다운로드시 포함되지 않습니다.

"experimental plot" 검색결과 141-160 / 206건

  • CV : Cyclic Voltammetry
    과 Reduction이 나타난 그래프 & P3HT와 PCBM.Experimental ... 과 current를 plot 함으로써 I-V curve를 얻을 수 있다.또한 환원 peak에서의 전압 (Epa)과 전류,(Ipa) 산화 peak 에서의 전압 (Epc)과 전류 ... ] Oxidation과 Reduction이 나타난 그래프 & P3HT와 PCBM.Experimental1) 실험 기구 및 시약? 실험기구micro-pipette, Cyclic Voltammetry
    리포트 | 9페이지 | 1,000원 | 등록일 2010.05.15
  • EXPERIMENT ac 5 Frequency Response of the series RL Network
    obtained experimentally in part 2(a)and calculated in Table 5.4.→ 계 산 과 정116.412. Given the network of Fig ... Table 5.2.→ 계 산 과 정3. Using PSpice or multisim, obtain a plot ofandversus frequency for the network
    리포트 | 11페이지 | 3,000원 | 등록일 2012.03.11
  • 환경공학실험, 염화물 결과 레포트
    와 결합잔류염소의 형태와 양을 측정해본다.Ⅱ. Experimental Procedures① 1.5 mg NH3-N/L 를 포함하고 있는 100mL의 물과 2 x 10⁻³M/L ... graph, plot the concentration (mg/L) of each chlorine compound measured versus total chlorine applied ... . Also show total chlorine residual on the same plot.3. Label each phase of the plot in question 2 and
    리포트 | 6페이지 | 1,000원 | 등록일 2009.06.22
  • RLC회로
    amplitude and thus said to exhibit resonance.Ⅲ. Experimental Techniques and MethodWe connected the ... as the experimentally determined resonance frequency.B. Behavior of the Circuit under the Square ... increased 200 Hz at each time. From the plot, we could observe that the amplitude maximizes within
    리포트 | 8페이지 | 1,000원 | 등록일 2009.12.22
  • 유속 실험 결과레포트 (유속계 검정)
    일.168수조0.04790.0730.1220.1330.159 개수로의 수심에 따른 유량7. Discussion1. On a single graph, plot the measured ... method and compare among them with experimental analysis.(각 방법에 대하여 평균 제곱오차를 계산하고 그 결과를 실험적 분석을 통해 비교
    리포트 | 14페이지 | 2,500원 | 등록일 2012.07.17
  • 형광
    ’ 농도에 따른 C의 해리 정도에서 P와 L’간의 착물 형성상수를 구할 수 있다.Experimental실험 방법(1) 1,8 ANS(97%) 를 이용하여 1.0 x 10⁻⁵M ... 해 plot을 한 후, 기울기 값과 절편으로부터 K 값과 △I¥ 을 구해본다.△I는 용액 중 전체 P 농도를 [P]o, L농도를 [L]o라고 할 때 다음 식이 성립하며,A = eP([P]나온다.
    리포트 | 8페이지 | 2,000원 | 등록일 2012.12.02
  • 알칼리도 결과
    에 존재하지 않는다.Ⅱ. Experimental Procedures① 초기 pH를 측정하고 페놀프탈레인 지시약을 실험 시작에 앞서 넣는다.② 적정하면서 색이 무색에서 핑크색으로 변하 ... .678.257.124.4010.548.656.92※ Laboratory presentation1.Plot pH versus ml of acid added for the ... titration of sample a. Denote equivalence points and approximate pH values.2.Plot buffer capacity (β= -ΔCA/Δ
    리포트 | 8페이지 | 1,000원 | 등록일 2008.12.12
  • 환경공학실험, ph, 색도, 탁도 결과 레포트
    며, pH 7보다 작은 값에서는 산성, pH7보다 높은 값에서는 알칼리성을 나타낸다.2. Experimental Procedures① 유리전극을 미리 증류수에 몇 시간동안 담가둔다 ... 다.2. Experimental Procedures① Spectrophotometer DR-5000을 부팅한다.② 증류수로 DR-5000을 보정한다. (point '0'으로 맞춤 ... 에 의하여 빛의 통과가 방해받는 정도를 측정하는 방법이다. 탁도 측정 시에는 tube에 지문이 묻지 않도록 조심해야한다.2. Experimental Procedures①
    리포트 | 7페이지 | 1,000원 | 등록일 2009.06.22
  • [제어공학]모터의 주파수응답 실험
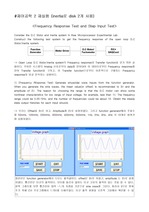
    .735) Overlap the Bode and Nyquist plots from experimental data on the Bode and the Nyquist Plot of ... Experimental Lab.Construct the following test system to get the frequency response of the open loop D ... obtained outputs draw the Bode Plot of the D.C Motor System.CVI 로부터 얻어낸 data 값으로부터 Matlab에서 bode
    리포트 | 14페이지 | 4,900원 | 등록일 2007.07.07
  • MOSFET 에 대한 실험 보고서
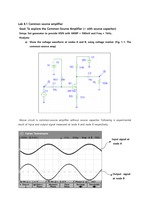
    ommon-source amplifier without source capacitor. Following is experimental result of input and ... . Following is experimental result of input and output signal measured at node A and node B respectively ... ?From the experimental results, the voltage gain of Fig. 1-1 is about -5.68. It is from the division of
    리포트 | 8페이지 | 1,500원 | 등록일 2008.12.15
  • 결과 실험11 EXPERIMENT dc 11 Thevenin`s Theorem and Maximum Power Transfer
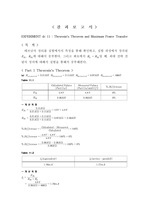
    Referring to the plot of Graph 11.1, what value ofresulted in maximum power transfer to? Record in Table ... 전달이 일어나는의 값은 이론적으로 예상한 값과, 실제 측정한 값, 두 값이 일치한다.< Part 3 Maximum Power Transfer (Experimental
    리포트 | 10페이지 | 2,500원 | 등록일 2011.06.09
  • 전기전자기초실험-Audio Amplifier Circuit Design결과
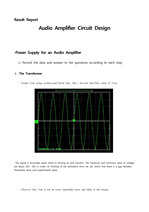
    the estimation error we can notice that there is a gap between theoretical value and experimental ... variable resistor which is below one.�� In PSPICE simulation, analyze Vout/Vin with Bode Plot in frequenc9K
    리포트 | 8페이지 | 1,000원 | 등록일 2010.10.31
  • 개수로의 유속측정 실험 결과 보고서
    graph, plot the measured discharge with different methods, Q, versus the flow depth in channel, y, m ... among them with experimental anlaysis.(수정)2. 유속을 통해 산정한 유량 값과 위어고를 통해 산정한 유량값의 차이를 비교하라.Q1월류고 H = 29.5c
    리포트 | 16페이지 | 1,500원 | 등록일 2012.11.11
  • Orifice and Free Jet Flow
    be caused by the experimental errors due to the low efficacy of measuring skills.From the data ... plotting the graph of against x, it will give a slope of .Orifice diameter = 3mm; head, H = 270
    리포트 | 11페이지 | 1,000원 | 등록일 2010.11.27
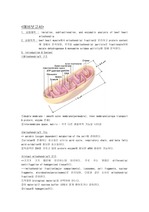
  • Isolation, subfractionation, and enzymatic analysis of beef heart mitochondria
    Svedberg units(S :)로 나타내지며, S가 작을수록 centrifugal field에서 느리게 움직인다.4. Reference- Modern Experimental ... 한 후 plot한다.ReagentsTube1Tube20.2M phosphate, pH 7.4650λ650λ0.0375M NADH (10X)-10λOxaloacetic acid ... solution50λ50λdW750λ740λ3. Result : Tube2에서의 absorbance에 대한 plotting graph4. 결과 분석 및 해석⑴plotting된 graph
    리포트 | 7페이지 | 3,000원 | 등록일 2009.05.01
  • newton method을 이용한 수치해석
    . Newton-raphson method is considered in report.Experimental ResultsRoot of initial guess 4.2 : 0.475, 26 ... studio and the Mathcad are used for programming and plotting.c언어/* example1.2 */# include #include
    리포트 | 5페이지 | 1,000원 | 등록일 2010.04.23
  • 회분식반응기 결과레포트
    ---------------41.4. 실험목적 ----------------------------------------------------52. EXPERIMENTAL ----- ... 을 결정한다.이제 일정부피인 회분식 반응기에서 다음의 반응을 행하면(1-9)양변에 대수를 취해서(1-10)따라서를 ?CA에 대하여 plot하면 기울기에서 반응차수 n을 구한다. CA ... 하면 농도-시간의 plot이 직선이 되게 된다. 이 방법은 일반적으로 반응차수를 미리 알고, 다른 온도의 결과로부터 활성화 에너지를 결정하는데 이용된다.1차반응 -rA = kCA이면 그
    리포트 | 24페이지 | 1,500원 | 등록일 2009.12.31
  • 핑퐁
    experimental plots, forms, and illustrations, 박민규 ParkMin-Kyu made the readers lead his world. The theme he
    리포트 | 18페이지 | 2,000원 | 등록일 2010.08.16
  • 대류(對 流)
    ·································································(5)여기서 a 와 b 는 상수이며 식(5)에 의하여 시간과 온도와의 관계를 plot ... , welometer, pitot tube 등)5. 실험방법 (Experimental method)① 300ml의 비커에 물과 온도계를 넣고 가열기에 올려놓아 약 99℃까지 가열한다.② 온도 ... 는가 확인하시오.solution)2.ln( TRIANGLE t)를 시간의 함수로 Plot 하시오.solution)3. 자연대류와 강제대류를 비교 검토하시오.solution)자연대류는 물질
    리포트 | 6페이지 | 1,500원 | 등록일 2008.03.13 | 수정일 2023.04.14
  • 교류회로 소자의 임피던스
    . RLC 직렬4. RC 병렬5. RL 병렬6. RLC 병렬6.Experimental Results1)실험1A.DataRkΩLHCuF입력전압V저항전압V인덕터전압V캐패시터전압V전체전류 ... 아 잘보이지 않는 파형들은 plot 을 추가 하여 나타내었다.2)실험2A.DataRkΩLHCuF리액턴스임피던스위상각이론Ω측정Ω이론Ω측정ΩRC4.74756.4256.64700 ... 을 연결하여 시뮬레이션을 수행하였다. 타 파에 비해 진폭이 너무 작아 잘보이지 않는 파형들은 plot 을 추가 하여 눈으로 확인해 보았다.저항 값은 큰데 비해 캐패시터 소자의 값
    리포트 | 15페이지 | 1,000원 | 등록일 2009.04.29
  • EasyAI 무료체험
해캠 AI 챗봇과 대화하기
챗봇으로 간편하게 상담해보세요.
2025년 10월 12일 일요일
AI 챗봇
안녕하세요. 해피캠퍼스 AI 챗봇입니다. 무엇이 궁금하신가요?
5:30 오후
문서 초안을 생성해주는 EasyAI
안녕하세요 해피캠퍼스의 20년의 운영 노하우를 이용하여 당신만의 초안을 만들어주는 EasyAI 입니다.
저는 아래와 같이 작업을 도와드립니다.
- 주제만 입력하면 AI가 방대한 정보를 재가공하여, 최적의 목차와 내용을 자동으로 만들어 드립니다.
- 장문의 콘텐츠를 쉽고 빠르게 작성해 드립니다.
- 스토어에서 무료 이용권를 계정별로 1회 발급 받을 수 있습니다. 지금 바로 체험해 보세요!
이런 주제들을 입력해 보세요.
- 유아에게 적합한 문학작품의 기준과 특성
- 한국인의 가치관 중에서 정신적 가치관을 이루는 것들을 문화적 문법으로 정리하고, 현대한국사회에서 일어나는 사건과 사고를 비교하여 자신의 의견으로 기술하세요
- 작별인사 독후감