• AI글쓰기 2.1 업데이트
  • AI글쓰기 2.1 업데이트
  • AI글쓰기 2.1 업데이트
  • AI글쓰기 2.1 업데이트
  • 통합검색(81)
  • 리포트(73)
  • 논문(4)
  • 시험자료(2)
  • 방송통신대(2)
판매자 표지는 다운로드시 포함되지 않습니다.

"interval graph" 검색결과 21-40 / 81건

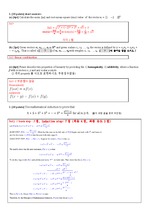
  • 가천대 2019 소프트웨어 수학 기말고사 시험문제/연습문제/이산수학/LinearAlgebra/
    ] Suppose that f is a function whose derivative f’ exists at every point in an interval I. Then, we can ... ’ and second derivative f”.Determine its f’ and f” is positive or negative, respectively, for each type of graphs given below.
    시험자료 | 5페이지 | 3,000원 | 등록일 2020.04.17
  • 판매자 표지 자료 표지
    화공계측실험 Pre-Report (5)-CSTR and Tubular Flow Reactor
    에 나온다.Charts : graph를 표현하고, 전도도와 온도를 시간의 함수로 plotting해준다.Analyze graph : 기록된 data를 수식적으로 분석한다.CSTR ... level이 overflow에 다다르면, stirrer를 키고 중간 속도로 맞춰준다. Regular interval에서 전도도와 온도를 기록한다. Flow rate를 약 40%로 낮춰주 ... 고 똑같이 regular interval에서 기록해준다. 온수 온도가 섭씨 45도에 이르렀는지 확인하고 온수 펌프를 연다. 다시 같은 과정을 반복한다. Flow rate를 다시 80
    리포트 | 5페이지 | 2,000원 | 등록일 2020.06.12
  • 연세대학교,전력및제어공학실험, 제어실험 1주차
    . Discussion3-1) Draw graph of using CEMTool (t=0~30, time interval=10msec)3-2) Insert title, x-axis ... we make a vector having elements from 1 thru 4 in interval of 1.-Transpose: a’ means we act ... -else statement7) Graph-Draw graphs-Graph information: We can configure the detail of information on
    리포트 | 16페이지 | 10,000원 | 등록일 2018.12.16
  • 인하대 나일론 합성 결과보고서
    를 얻기 위해서는 별도의 분리, 정화 공정이 필요하다.Emulsion PolymerizationSmith – Ewart Theory을 이용하여 해석하면 다음과 같다.* Interval ... 이 생성되면, 중합 반응을 시작한다. 라디칼이 생성되지 못한 미셀은 소멸된다. 이 기간이 끝나면, 증가하는 중합체 입자 수는 일정하게 유지된다.* Interval 2(10 ... 는 과정에서 원래 실험방법에서 하고자 했던 data와 약간의 오차가 발생하였다. 접촉각 측정측정한 접촉각(θ) 및 이론적인 γLV값.cos θ vs 1/γLV graph (x
    리포트 | 10페이지 | 1,000원 | 등록일 2020.09.15
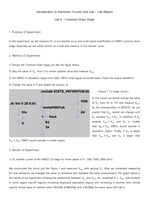
  • 기초전자회로 및 실험 - CD Stage
    this procedure, we inject and tried to find that maximizes small signal gain. As we saw graph in ... means slope of tangent in graph) To find out the maximum point, we choose some candidates from the ... and , NMOS operates in triode region. Therefore, we could check the form of graphs in Figure 2 and c
    리포트 | 5페이지 | 2,000원 | 등록일 2019.10.26 | 수정일 2021.09.23
  • 동물생리학 물고기 행동 실험 포스터
    liters of water into three water tanks and draw three lines at the same interval.(2)Treat each tank ... minutes at 10-second intervals.▶ (1) After treating zebrafish with Isoproterenol plate for 10 minutes ... . Effects of VPA on movement of zebrafish (A) is a photograph of fish in each tank. (B) is graph s
    리포트 | 3페이지 | 1,500원 | 등록일 2018.10.25
  • [연세대학교 물리학과 물리학실험(A-1)] 2번 실험 결과레포트 (연세대학교 물리학과 전공필수 실험과목)
    Interval with Probes >Similarly, we can recognize the time interval while charging is almost identical ... interval was observed very small, so that it has shown very large error percentage.2) DifferentiatorA ... are 0. For a square wave, we had got clear, sharp graph. For a sine wave, we observed a lot of
    리포트 | 9페이지 | 5,000원 | 등록일 2019.07.23
  • 인하대 수문학(A+) 과제#1
    )`(편의상```220mm로```정함) (c) Construct histogram and relative frequency graph도수분포표히스토그램 상대도수(d) Discuss ... (a) the recurrence interval and return period exceeding 2,500m ^{3}/sec of and (b) the probability
    리포트 | 5페이지 | 1,500원 | 등록일 2019.06.17
  • 생활과 통계 중간과제물 문제풀이
    다.예) 당사의 서비스 품질은 타사와 비교하여 어느 정도입니까?(1) 매우 만족 (2) 대체로 만족 (3) 보통 (4) 불만족 (5) 매우 불만족3. 등간척도 (Interval ... 종류를 설명하라.일반적으로 통계자료를 제시하는 방법에는 글(Text), 통계표(Table), 그래프(Graph) 등이 있다. 글은 가장 일반적이고 1차적인 자료제시 방법이나 자료량
    방송통신대 | 11페이지 | 3,000원 | 등록일 2019.09.10 | 수정일 2019.12.23
  • 카이스트 Bioengineering Laboratory 1 lab8_final [Cardiovascular Physiology]
    시키고, 이로 인해 피는 대동맥을 통해 온몸으로 퍼져나가고 다시 대정맥을 통해 심장으로 유입된다. 이러한 심장의 정상적인 활동여부를 검사하기 위한 방법으로 혈압측정, ECG graph ... 혈압나는 electrical activity를 측정하기 위해 피부에 electrode를 붙여서 기록한다. 이렇게 기록한 ECG는 Figure 1과 같다.ECG graph는 P, Q ... 이하이다. PQ wave의 interval은 동맥에서 심실까지 자극이 전달되기 까지 걸리는 시간, AV node의 delay time을 의미한다. Q, R, S wave를 합쳐서
    리포트 | 14페이지 | 2,500원 | 등록일 2015.01.04
  • 인하대 수문학(A+) 과제#2
    rainfall data with a 15 minutes interval from 7:00am to 10:00am. Calculate rainfall intensity for the ... durations of each 15 minutes and plot the intensity-duration graph.Table .1 Cumulative Rainfalltime7
    리포트 | 4페이지 | 1,500원 | 등록일 2019.06.17
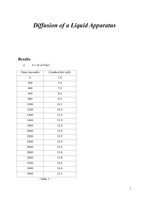
  • Diffusion of a Liquid 실험 보고서 (액체의 확산 실험 보고서)
    and will be calculated.From data in table 1, it could be shown in graph as figure 1, x axis as time(s ... econds) and y axis as conductivity(µS).< Figure 1 >< Figure 2 >Add trend line on figure 1 graph and ... it becomes graph shown in figure 2. Trend line has been noticed as y = 0.0028x + 6.0242, which means
    리포트 | 5페이지 | 1,000원 | 등록일 2016.10.16
  • 판매자 표지 자료 표지
    생활과통계1공통) 국가통계의 필요성과 개인 기업 정부의 이용자 활용방법을 구체적으로 설명하고 자료측정 시 척도의 방법을 나열하고 예를 들어 설명하라0k 생활과학과 생활과통계1공통
    (가볍다, 보통이다, 심하다), 강도측정. 운동(자주, 가끔, 전혀) 빈도 측정. 제품 선호도 순위, 토너먼트 게임의 팀 순위3) 등간척도등간척도(interval scale)는 명목 ... 적 방법 등이 있다.문제4. 자료의 그래프에 의한 시각화의 장점과 그 종류를 설명하라.1) 시각화의 장점통계에서 그래프(Graph)란, 어떤 자료를 시각화시켜 그 자료를 이해하기 쉽
    방송통신대 | 9페이지 | 6,000원 | 등록일 2018.09.17 | 수정일 2018.10.02
  • 판매자 표지 자료 표지
    인장 실험 결과보고서(성균관대)
    result of this test is a graph of load versus displacement. Since the amount of weight needed to s ... .⑤ Set the Dial Indicator to zero.⑥ Rotate the Load Nut as much prescribed interval.⑦ Record Dial ... n with no heat treatment. Using the data and some equations, I can get four graphs, load
    리포트 | 9페이지 | 2,000원 | 등록일 2016.05.04 | 수정일 2016.05.08
  • 인장실험 결과보고서, 고체역학, 고체역학 실험, tensile test report
    test we draw 5 diagram. 3 is engineering stress-strain graph and 2 is true stress-strain graph ... zero7.Rotate the Load Nut as much prescribed interval.8.Record Dial indicator and resume step 6 until ... refiches 10 kg.3. Results(1) strain-gauge test[Figure 1]Engineering stress-strain graph그림 1은 각 4가지 재료
    리포트 | 12페이지 | 1,500원 | 등록일 2016.06.16
  • DSP실험 lab3
    have the same sampled values, which occur at intervals of =1/ msec.x(t) = x(nT)t=nTs = n/fsx(t) = 2s ... *n)c. Interpolate the sampled signals and plot the interpolated sampled signals on the same graph
    리포트 | 10페이지 | 1,000원 | 등록일 2016.09.20
  • 1주차 결과 Chapter 1. PSpice Simulation
    interval and Plot the current value through Q1.Figure 1-10. Simulation result of BJT circuitRoughly ... ommon emitter circuit. When we implement this circuit by using AC sweep, we can obtain the graph like ... Figure 1-12. We expected the graph must be flat until some large frequency f0. As expected, we c
    리포트 | 11페이지 | 1,000원 | 등록일 2015.02.07
  • 07. RLC Circuit report
    Figure 1, there are graphs of three oscillation.Figure SEQ Table \* ARABIC 1 The graph of the voltage ... for each resistor. Figure 2 is the graph of the current versus the frequency. For each resistor, the ... (Hz). So it is meaningful value.Figure SEQ Table \* ARABIC 2 The graph of the current at the circuit
    리포트 | 5페이지 | 1,000원 | 등록일 2014.06.11
  • 한양대 원자력공학과 수치해석 과제 5
    한 값들이 나온 것을 알 수 있다.2. Solve the following initial value problem over the interval from t=0 to 3 where ... y(0) = 1. Display all your result on the same graph.(a) Analytically.(b) Using MATLAB function ode
    리포트 | 9페이지 | 1,000원 | 등록일 2015.09.06
  • 이동통신네트워크 프로젝트 보고서
    /sec 항목을 통해 현재 장치의 Throughput을 알 수 있다.6) Statics - IO graphs에서 filter, style, interval 등 여러 가지를 설정 ... 할 수 있다.7) Statics - Flow graph를 클릭하면, 패킷을 어떻게 주고받았는지 확인이 가능하다.8) Statics - TCP stream graph ... - Throughput graph을 클릭하면 Throughput 정보를 확인할 수 있다.2-2 inSSIDer 2.1 사용법 및 수행 예제1) SSID(Service Set Identifier
    리포트 | 33페이지 | 2,500원 | 등록일 2013.12.20 | 수정일 2014.06.20
  • EasyAI 무료체험
해캠 AI 챗봇과 대화하기
챗봇으로 간편하게 상담해보세요.
2025년 10월 07일 화요일
AI 챗봇
안녕하세요. 해피캠퍼스 AI 챗봇입니다. 무엇이 궁금하신가요?
11:42 오후
문서 초안을 생성해주는 EasyAI
안녕하세요 해피캠퍼스의 20년의 운영 노하우를 이용하여 당신만의 초안을 만들어주는 EasyAI 입니다.
저는 아래와 같이 작업을 도와드립니다.
- 주제만 입력하면 AI가 방대한 정보를 재가공하여, 최적의 목차와 내용을 자동으로 만들어 드립니다.
- 장문의 콘텐츠를 쉽고 빠르게 작성해 드립니다.
- 스토어에서 무료 이용권를 계정별로 1회 발급 받을 수 있습니다. 지금 바로 체험해 보세요!
이런 주제들을 입력해 보세요.
- 유아에게 적합한 문학작품의 기준과 특성
- 한국인의 가치관 중에서 정신적 가치관을 이루는 것들을 문화적 문법으로 정리하고, 현대한국사회에서 일어나는 사건과 사고를 비교하여 자신의 의견으로 기술하세요
- 작별인사 독후감