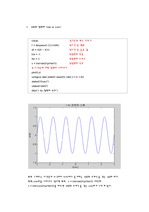
matlab으로 신호를 FFT하고 특정 주파수영역 출력하는 과제입니다.
*형*
- 최초 등록일
- 2009.05.05
- 최종 저작일
- 2008.10
- 3페이지
 압축파일
압축파일 - 가격 2,000원

다운로드
장바구니
해피캠퍼스는 구매자와 판매자 모두가 만족하는 서비스가 되도록 노력하고 있으며, 아래의 4가지 자료환불 조건을 꼭 확인해주시기 바랍니다.
| 파일오류 | 중복자료 | 저작권 없음 | 설명과 실제 내용 불일치 |
|---|---|---|---|
| 파일의 다운로드가 제대로 되지 않거나 파일형식에 맞는 프로그램으로 정상 작동하지 않는 경우 | 다른 자료와 70% 이상 내용이 일치하는 경우 (중복임을 확인할 수 있는 근거 필요함) | 인터넷의 다른 사이트, 연구기관, 학교, 서적 등의 자료를 도용한 경우 | 자료의 설명과 실제 자료의 내용이 일치하지 않는 경우 |


24시간 응대가능한
AI 챗봇이 런칭되었습니다.
닫기