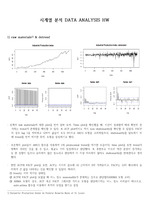
시계열 분석 DATA ANALYSIS HW 1) raw materials Industrial Production Index by Federal Reserve Bank of St. ... Time plot을 확인했을 때, 시간이 경과함에 따라 확연히 증가하는 trend가 존재함을 확인할 수 있다. ... 오른쪽의 plot들이 diff(1) 함수를 사용하여 1차 ploynomial trend를 제거한 모습이다. time plot을 보면 trend가 명확히 사라진 것을 볼 수 있고, 평균도
The research utilizes a time-series model and a multiple regression model, and calculates
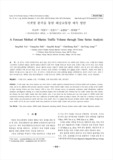
modal demand ... This study analyzes the impact of gas price on
transit (bus and subway) demand using monthly data and ... The result shows that elasticities of subway demand with respect to gas
price is higher than those of
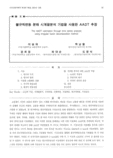
through a time series analysis [목 차] 제Ⅰ장 서 론 제 1 절 연구의 배경 및 목적 ·············· 1 제 2 절 연구방법 ········· ... 학사학위 졸업논문 시계열분석을 통한 제주도 관광객 수요예측의 실증적 분석 A empirical study on the demand Forecasts of Jeju-island visitors
시계열 분석(time series analysis) 1. ... 시계열 분석의 개념 시계열 분석(time series analysis)이란 관측된 과거의 시계열 데이터를 여러 가지 구성요소로 분석하여 법칙성을 발견하고, 이를 모형화하여 그것으로 ... series ))과 함께 모형화 하여 분석하는 방법이다.
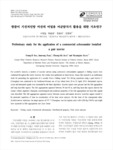
be presented regardless of time in consideration of the time series analysis. ... For scientific research, a number of acoustic surveys using commercial echosounders equipped in fishing ... Hence, this research is an preliminary study for presenting the application of a sounder from a fishing
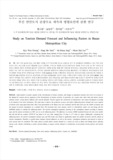
In this study, time series analysis was tried, which is widely applied to demand forecast of diverse ... The study has a meaning in that future traffic volume was forecasted per month with timeseries model ... Also, it is judged that forecast of future marine traffic volume through timeseries model will be the
The univariate time series analysis, which is a deterministic model, was used along with the SARIMAX ... This study aims to improve the prediction accuracy and explore influencing factors through timeseries ... The difference in accuracy (RMSE standard) between the timeseries models that did and did not consider
현대에는 선택기반형 결합분석(choice-based conjoint analysis)을 바탕으로 방법론이 발전하고 있다.112) 시계열분석(time-seriesanalysis)의 ... 이를 위해서는 비교 척도(comparative scale)를 활용하여 수집된 데이터가 가장 적합하다. ... ARIMA 모형은 데이터의 정상성(stationarity)을 유도하여 시계열분석이 가능하게 한다.
42) 시계열분석(time-seriesanalysis)의 목적과 특징을 설명해 보세요.▶ 양적으로 수집된 종단적(longitudinal)인 데이터를 분석하기 위한 기법으로, 어떤 ... ARIMA 모형은 데이터의 정상성(stationarity)을 유도하여 시계열분석이 가능하게 한다.
유해한 반응 세트로 인해 신뢰도가 낮아졌을 경우, 질적으로 다른 집단을 표본으로 하는 사전조사(pre-test)를 실시하여 신뢰도를 재측정할 수 있다.7) 시계열분석(time-series ... analysis)의 목적과 특징을 설명해 보세요.■ 양적으로 수집된 종단적(longitudinal)인 데이터를 분석하기 위한 기법으로, 어떤 변인이 다수의 시점에서 측정되고, 이후
7) 시계열분석(time-seriesanalysis)의 목적과 특징을 설명해 보세요.■ 양적으로 수집된 종단적(longitudinal)인 데이터를 분석하기 위한 기법으로, 어떤 변인이 ... ARIMA 모형은 데이터의 정상성(stationarity)을 유도하여 시계열분석이 가능하게 한다. ... 가장 근본적인 가능성은, 탐색적 조사(pilot survey)와 사전검사(pre-test)를 하지 않았기 때문에 '예상치 못한' 분석결과를 만나게 되었다는 것이다.
This approach is more powerful than the time-series methods. 주로 time-series모델보다 더 좋다. ... 시간에 따른 변화량만 예측하는 time-series 모델과는 다르게 하나 이상의 요인에 대한 결과값을 예측한다. ... (seasonality, trend 모두를 고려한 결과물) Associative Models_연관 모델 여지 것 배웠던 timeseries 모델이 아니다.
Finally, time series analysis was carried out by various forecasting model, such as regression, exponential ... The correlation between track irregularity and seasonal changes was conducted based on ARIMA model analysis ... 120, an railway inspection system in Korea includes unavoidable incomplete and erratic information, so
Thus, I converted yield, ET, FAB, and FDC data into a timeseries trend to conduct a commonality analysis ... “Recording all issue information and data” After completing the semiconductor low-yield data analysis ... was at 5 seconds, and then, the photolithography process was performed by controlling the exposure time
On the granular level, the combinations of time series analysis and anomaly detection algorithms will ... The data collected here will be in form of timeseries that will be collected and stored into the cloud ... Descriptive Analysis Objective: Present current/future energy use, and savings or possible savings The
These methods were applied across diverse periods and time intervals. ... from January 1st, 2018, to December 31st, 2022. ... The results were validated through a random selection of 100 days (20 target dates per year) spanning
(E) 단계 3.2(b)에서 Analysis type을 Time Domain (Transient)으로, Run to time과 Maximum step을 각각 2m와 1u sec로 설정한 ... )에서 얻어진 transfer characteristic curve를 비교하고 분석하라. - 단계 3.1(a)의 기울기는 -2k이고, 단계 3.2(a)의 기울기는 -1.2k이다. series-series의 ... 전원 전압원은 12V로 고정하고 입력저항 및 부하저항을 1kΩ, 피드백 저항은/ 가 되도록 R1, R2값을 설정하고, Simulation Profile에서 Analysis
같은 time-series model은 수요를 예측할 때 consecutive year data가 필요합니다. ... , causal model 중 가장 적절한 것이 무엇인지와 그 이유를 서술하라. time-series model은 자기 상관성으로 인해 외생변수, 즉 예측이나 통제가 불가능한 불규칙 ... model은 오직 과거 자료만을 분석하는 기법이고, causal model은 과거 자료를 통해 인과 관계식을 추정하는 것입니다. time-series model만을 활용하다가 인과관계