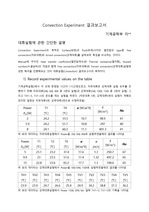
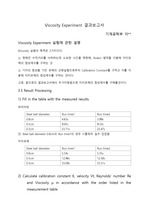
Draw and analyze graphs of △T – Pel and Nu - Pel referring to the table. ... analyze the horizontal temperature graph above the plate in the duct and the vertical temperature graph ... Record experimental values on the table 기계공학실험2에서 각 조에 한정된 시간이 1시간정도였고, 자유대류와 강제대류 실험 모두를 진행하기 위해 자유대류
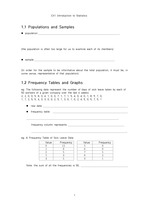
andGraphseg. ... 1.1 Populations and Samplesl population: . ... about the total population, it must be, in some sense, representative of that population)1.2 Frequency Tables
위의 table을 바탕으로 작성한 graph는 다음과 같다. 7. ... Prelab Q&A 2. 실험 제목 3. 실험 목적 4. 실험 장비 5. 실험 절차 6. 실험 결과 및 분석 7. 고찰 8. 결론 9. Postlab Q&A 10. ... 76 144 4 144 97 145 6 145 107 146 2 146 87 147 8 147 100 148 9 148 88 149 3 149 91 150 7 150 83 Data table
Fitted graphs of Time vs. Mean Square Displacement according to number of monomer Table 2. ... Time Correlation Function with error bar (left) and without error bar (right). Table 1. ... Diffusion Coefficient according to number of monomers and its fitting graph Theoretical value of diffusion
That is why graph of andgraph of are not fitted perfectly with actual graphs. ... Basic equation for trapezoidal method is So, I extract values from table4, and then import data into ... 1) Experimental data for Lift force Table 2) Experimental data for Drag force Table 3) Rearranged data
].g) Calculate the maximum Vpp which BJT can be operated on the edge of saturation using Graph 8.1 and ... Then fill the [Table 8.2].c) Calculate the α, β, rπ, gm, Ai, Av (gm, rc) and fill the [Table 8.3]. d) ... record on [Table8.4].
Table showing processed data of 1/T (K-1), ln time and standard deviation Data Analysis Graph 1. ... (aq) and 1% indigo carmine (aq) with error bars showing ± one standard deviation Graph 2. ... presentation Data of light absorbance and time to reach 0 absorbance unit was used to plot graph between
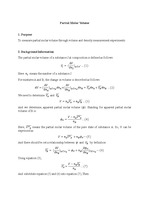
By visualizing the graph through [Table 2], the following linear graph [Graph 1] can be obtained. ... As shown by [Table 2] and [Table 3], the difference between the temperature measured by PRT and the reference ... Vapor Pressure Thermometer [Graph 6] Temperature between Reference and Vapor Pressure Thermometer The
Plot the predicted h = f (Q) obtained in 3. in the same graphand compare it with the experimental graph ... Plot the predicted h = f (Q) obtained in 3. in the same graphand compare it with the experimental graph ... L/min ** Read from manometer *** By observing (관찰) the bed particles Plotting & Discussion Draw a graph
Table3.2 (5) Probit (Line) (6) Expected effect form col(5) andTable 3.2 (7) Observed effect(%) (Table3.3 ... (graph 2) ⑫ graph를 통해 얻은 식을 Table 3.2을 사용하여 expected effect2을 구한다. ⑬ expected effect2를 다시 graph로 나타낸다 ... 3.3을 통해 다시 observed effect를 구한다. ⑩ observed effect를 가지고 Table 3.2을 통해 probit3을 구한다. ⑪ probit3를 가지고 graph를
Temperatures remain stable until - just over there at the end of the graph. ... We've been around for about 300,000 years but it's only in this period of warm and stable temperatures ... how carbon dioxide spikes here at the end of the graph.
Set CONFIG button as your test condition and leave le SEQ Table \* ARABIC 1. ... We found the stress and strain then plot the graph. ... Plotting graph of engineering stress & strain values.
SEQ Table \* ARABIC 1 Observation data and data processing Volumes of Solution and Partial Molar Volumes ... Observations and Data (Assignment) 1) Calculate the partial molar volume of various NaCl solution Table ... Significant figures had to be fully considered, and the shape of the graph had to be clearly known by
SEQ Table \* ARABIC 1. experiment 1 Graph 1 과 table 1 을 보면 conductivity와 conversion이 순식간에 변화하는 모습을 볼 ... Final-Report (5) 실험 제목 CSTR and Tubular Flow Reactor 실험 결과 실험 5에서는 reagent들을 CSTR과 Tubular Flow를 활용하여 ... High speed (중반) graph SEQ graph \* ARABIC 2.
If the positive and negative voltage input is , , the output voltage shows the graph like Eq 3.1 & Figure ... Resistance value of Resistors and Cds Cable SEQ Table \* ARABIC 8. ... A Graph of Output Voltage in Experiment 5 Discussion Voltage Measurement Experiment with a Photoresistor