Then the received signal, can be modeled as where is Gaussian with mean zero and power spectral density ... Anyway, when the noise powerdensity is 0.2[Watt/Hz], the sor QPSK Modulator > ② Plot the results in ... Simulation Project #2 We assume the simple digital communication systems as shown in figure 2-1. is
A material with many atoms in such an excited state may thus result in radiation which is very spectrally ... What are the two requirements to be met if the photon density is to build up for the stimulated emission ... Specifically, the intensity of the scattered light varies as the sixth power of the particle size and
음성신호를 녹음하여 이것을 이용하여 power spectral density를 구해보고 그림을 그려본 후, 노이즈를 주어보고, 마지막으로 Least square filter를 이용하여 ... 디지털 신호처리 과목에서 least square filter를 C로 구현한 자료입니다. 다른말로 Wiener filter라고도 하는데, 이런 자료가 흔치 않은것으로 알고있습니다.
Whiman(2003)은 각 오디오의 5초 이상의 power spectral density(PSD)평가를 사용하여 음악 이해를 위한 unsupervised(비지도) 메소드를 사용한다 ... 첫 레벨은 오디오 파일의 sampling rate와 같은 객체의 물리적 특성을 포함하고, 몇 가지의 기본 특성은 오디오 프레임의 spectral centroid나 주요 코드를 좋아한다 ... 그러면 그것은 가장 중요한 의미를 포함한 semantically 차원을 유지한다.
The powerspectraldensities of these two signal will coincide within ±3dB. ... In this paper, a signal which has the same power spectral density, but has different kurtosis is generated ... This paper shows through such FDS comparison that a difference in fatigue life prediction may result
N _{0} =`` {P _{N}} over {B _{N}} ``, N _{0} is the noise power spectral density, P _{N} is the noise ... Describe the probability density function of Gaussian white noise. ... Zero the True RMS Voltmeter / Power Meter, set the MODE switch to dBm, and select the appropriate RANGE
spectraldensity of X PSD_Y=fftshift(fft(ACF_Y,2^15-1)); % power spectral density of Y PSD_N=fftshift ... Y의 autocorrelation을 FFT하면 Y의 power spectral density를 구할 수 있다. Y의 PSD를 구해 plot해 보라. ... (fft(ACF_N_equ,2^15-1)); % power spectral density of Noise figure(5) subplot(3,1,1) plot(f2,abs(PSD_Y
and Optical Transmittance ● Optical transmittance in cavity Using Power series Resonant Cavities (Micro ... width of the cavity resonance and the spectral width of the natural emission spectrum must be determined ... (Micro Cavity effect) ● Integrated emission enhancement Factor (Gint) To calculate the factor, the spectral
Type 'help wavread ' pause psd (x,1024,fs); % the power spectral density using the 1024-point DFT pause ... so that there are even some shape of holes at the point). ... PSD : From the graph, we can find that the two impairing frequency’s magnitude became smaller (much smaller
In spite of LED powerdensity, there were rapid growth rate of NHost and no significant of Ca++, IP and ... Low energy photon irradiation by light in the far red to near infrared spectral range(630~1000nm) using ... Statistically, a significant difference was not found between LED powerdensity.
The experiment was conducted by calculating the power spectral density function to compare the frequency ... spectrum and signal power. ... In this research, we have used hammer as an impulsive source and compared the signal powers generated
위에서 구한 autocorrelation의 FFT를 취하면 신호의 Power spectral density를 구할 수 있다. power spectral density의 magnitude를 ... 이 때 noise power는 signal power P의 10%로 한다. Y를 plot해 보고 Y를 소리로 들어보라 어떤가? 3-2. ... 신호의 sample 수가 2^14이므로 autocorrelation function의 길이는 2*2^14-1 = 2^15-1의 크기가 될 것이다. autocorrelation functioin을
- : Power spectral density - Properties of Power spectral density Random Process □ Power Spectral Density ... Gaussian distribution as j - ∞ Random Process □ white noise - Power spectral density is the same for ... ’s theorem - The waveform energy spectraldensity(ESD) (even function) - unit : J/Hz SpectralDensity
spectraldensity) - 평균전력 S(f) : 주파수에 따라 전력밀도의 변화 - 옴당 총평균 전력값 - 우함수 (even function) ● 시평균 자기 상관 함수 ( ... - 변환 정리 - 쌍대정리 - 주파수 천이정리 - 변조정리 - 미분정리 - 적분정리 - Convolution 정리 - 곱셈정리 2.4 전력스펙트럼밀도와 상관 ● 전력스펙트럼밀도 (Power ... slope overload 없이 메세지 신호를 추적가능 조건 : 여기서, : impulse 함수의 step 크기 : sampling period A : 진폭 ?
. soundsc(x0,fs0) soundsc(x1,fs1) %% (c) Plot their power spectral density functions in the same figure ... Do the listening test. %% M=7, 15, 23, 31, 39, ... %% (f) Plot the power spectral density function of ... spectrum density function of the filtered signal with the original.
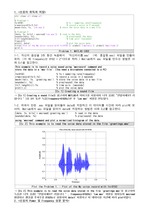
spectraldensity function The figure above is the power spectral density function of the original signal ... figure-2, and the power spectral density of both the original signal and the filtered signal on figure ... The power spectral density of the filtered signal declines at higher frequencies compared to the original
spectraldensity function 위의 그림은 original signal과 filtered signal의 power spectral density function의 ... 그래프이다. original signal과 비교하여 filtered signal의 power spectral density가 주파수가 커질수록 점점 감소하는 것을 관찰할 수 있었다. ... spectraldensity function soundsc(x,fss) pause % filter "nitehfn.wav" and listen to the filtered signal
diagram ..PAGE:7 ⅱ) magnitude response of the filter ..PAGE:8 ⅲ) two power spectral density function ... spectraldensity function soundsc(x,fss) pause % filter "nitehfn.wav" and listen to the filtered signal ... [dn dd] = impinvar(np, dp, fss); y = filter(dn, dd, x); hold on % add filtered signal's power specrtal
: Pt = 10 mW Power loss in channel: 20 dB Noise power spectral density: No=10 W/Hz Required BER: Pb=10 ... 이를 통하여 M을 구하여 simulation steps 에 집어 넣어 만든다. ... Eb/No을 구하는데 Eb=pt X power loss X Tb 이고 No 은 주어짐. 이때 power loss 가 20dB 이므로 10 을 해줌. 이렇게 Eb/No을 구한다.