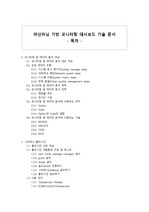
특히, 빅데이터를 활용하여 사회적 활력, 경제적 활력수준 평가와 지역별 정주여건 수준을 함께 고려하여 작성된 지역활력도의 활용성 제고를 위해 디지털 대시보드를 설계하여 구현하였다. ... 구현된 디지털 대시보드는 지역간 비교를 통한 격차확인이 가능하며, 사용자가 원하는 지역의 시계열 변화에 따른 상이한 인구감소 문제 대응방향과 주도적인 해결방안 모색에 기여할 수 있다
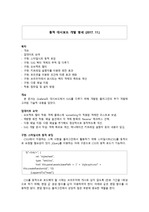
0.5. 모니터링 및 데이터 분석에 사용되는 언어0.5.1. Python다양한 종류의 처리 및 분석 방법을 제공하고 빠른 아이디어 구현에 도움을 주는 언어를 기반으로 모니터링 및 데이터 분석의 전처리를 지원한다 Python.0.5.2. ScalaJVM( ) Scala ..
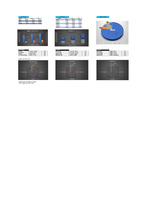
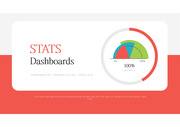
STATS Dashboards POWERPOINT PRESENTATION TEMPLATE Lorem Ipsum has been the industry's standard dummy text ever since the 1500s, when an unknown printe..
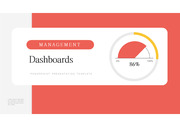
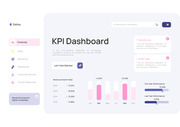
Dashboards POWERPOINT PRESENTATION TEMPLATE Lorem Ipsum has been the industry's standard dummy text ever since the 1500s. MANAGEMENT 86% 0% 100% 2024 ..
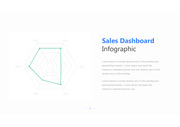
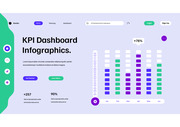
10% 2 0% 7 0% 5 0% 4 0% 8 0% Sales Dashboard Infographic Lorem Ipsum is simply dummy text of the printing and typesetting industry. Lorem Ipsum has be..
Sales Dashboard Infographic Presentation Template Charting Courses to Optimal Performance. Daily Working Routine $ 320 ,000 Option Data A Lorem ipsum ..
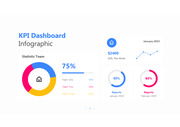
Reports February 2023 63% Reports January 2023 50% $2400 20% This Week January 2023 75% Team One 25% Team Two 45% Team Three 30% Statistic Team KPI Da..